Evolution over the last 10 years for the main parameters of certified French garlic and shallot plant production.
Production structures
Distribution of garlic plant production surfaces (2019)
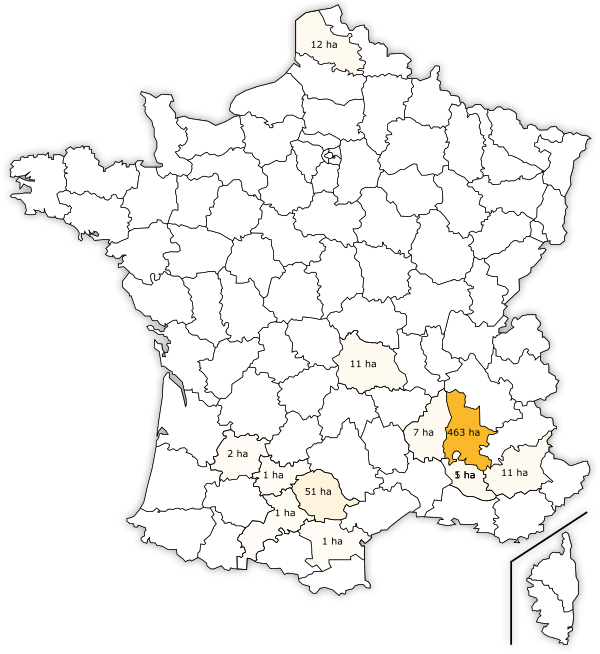
Implanted surfaces has fluctuated annually between 470 and 560 ha with maximum of 560 ha in 2019.
The total number of farmers is constant: 95 in 2019. The area average by farmer is 5,9 ha.
![]() The organic surfaces increase: 8,4 ha in 2012 to 34 ha in 2019. It represents 6% of global surface.
The organic surfaces increase: 8,4 ha in 2012 to 34 ha in 2019. It represents 6% of global surface.
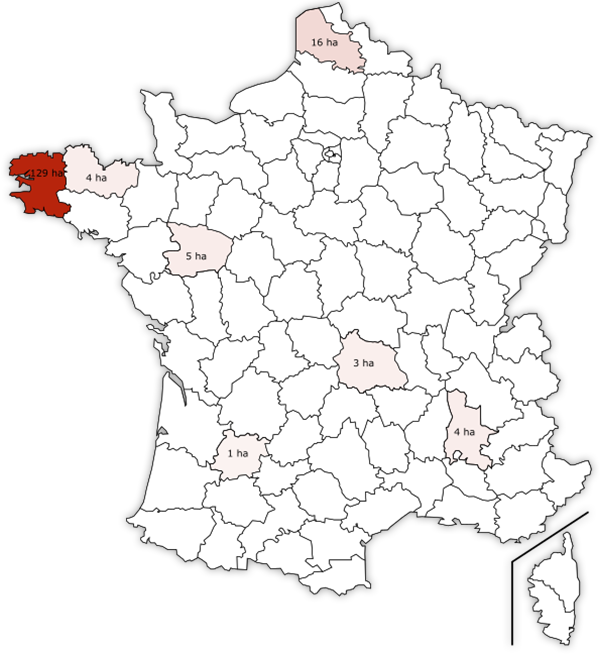
Distribution of shallot plant production surfaces (2019)
Implanted surfaces has fluctuated annually between 152 and 162 ha with maximum of 162 ha in 2019.
The total number of farmers is constant: 32 in 2019. The area average by farmer is 5 ha.
![]() The organic surfaces increase: 1,8 ha in 2012 to 25,9 ha in 2019. It represents 16% of global surface.
The organic surfaces increase: 1,8 ha in 2012 to 25,9 ha in 2019. It represents 16% of global surface.
Top varieties
Garlic
| Varieties | Acreage (2019) | Quantity (2018/2019) |
|---|---|---|
| Germidour | 128 ha | 10 364 Qx |
| Messidrome | 101 ha | 8 341 Qx |
| Messidor | 99 ha | 8 132 Qx |
| Flavor | 31 ha | 1 703 Qx |
| Therador | 31 ha | 3 023 Qx |
Shallot
| Varieties | Acreage (2019) | Quantity (2018/2019) |
|---|---|---|
| Longor | 82 ha | 13 059 Qx |
| Jermor | 26 ha | 4 443 Qx |
| Mikor | 14 ha | 2 285 Qx |
| Vigarmor | 8 ha | 1 483 Qx |
| Griselle | 6 ha | 385 Qx |
Marketing
Production evolution (hundredweight) from 1998 to 2019
Garlic Shallot Total